Bird gallery
Follow the image link to see the bird gallery.
1. Look carefully at Graph A. This shows monthly sightings of birds at Holloways Beach Environmental Education Centre (HBEEC) over the years. Note how each one may be commonly, occasionally, rarely or not yet seen for that month.
2. Choose the month of the year that your group will visit HBEEC. Look at the list of birds for that month. Note down all the birds seen under the headings Common, Occasional, Rare, Not Seen. How many are in each group?
3. Choose any (2) from the Common Group (pick ones you don’t know already). For each bird, do the following by using the bird descriptions at List A.
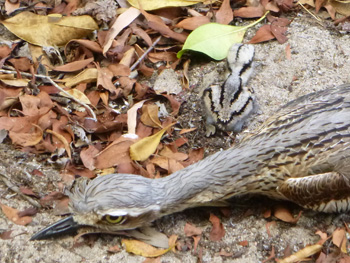
(a) Look carefully at the photo. You must be able to recognize this bird if seen. Draw/download/copy this, and write the size and main colours beside it.
(b) What are two features about this bird that will help you identify it
(c) What types of food does it eat?
(d) Does this bird live in the area the whole year?
4. Choose (1) other bird that is either occasional or rare.
(a) Look carefully at the photo. You must be able to recognize this bird if seen. Draw/download/copy this, and write the size and main colours beside it.
(b) What are two features about this bird that will help you identify it?
(c) What types of food does it eat?
(e) Does this bird live in the area the whole year?
5. You will be adding to the bird sighting when you visit. There are many things that may affect how well you spot and identify them. Discuss with (your teacher/each other) the following.
(a) Weather – Fine, Cloudy, Rainy etc
(b) Tide Height – Low, High
(c) Groups Ability/”Enthusiasm” to sight/Identify
(d) Length of boat trip/time of day.
Average monthly sightings
This set of graphs is similar to Graph A. It shows the percentage of average monthly sightings for each bird over the years, e.g. Pelican graph – In September, the pelican has been observed on 63% of all trips done in that month.
This information can be used to help determine bird’s movements or migration over the year and seasons.
1. Go to the graph for the Torres Strait pigeon, in “Pigeons and Doves”.
(a) In what months is it usually seen?
(b) When is it absent or very rare in the area?
(c) Does this suggest that the bird is migratory, or could there be other explanations for its absence in the winter months?
(d) Go to the map in the bird descriptions of this bird, and see if this helps in explaining the monthly sightings at HBEEC.
2. Go to the graph for Sandpipers, and locate the line for the Whimbrel.
(a) Is the Whimbrel seen at most times of the year at HBEEC?
(b) Would you think from this information that the Whimbrel is a migratory bird?
(c) Would you think the same about the Eastern Curlew? (shown on the same graph).
(d) Go to the map in the bird descriptions of the Sandpiper group, and also the written information under the Whimbrel.
(e) Does the information there agree with your answer to (b)? If not, give some reasons why this bird is seen all year round at HBEEC.
Activities/questions for Graph Set C
Yearly sightings
This set of graphs show the percentage of yearly sighting for each bird for each year. eg. Pelican graph – was sighted on 26% of trips in 1998 and 17% of trips in 2000.
This information can be used to indicate possible changes in numbers or presence of the bird over time.
(It is important to remember these are indicators only – eg. there may be only 2 birds of the one type in the whole area, but they may be seen every trip).
1. Go to the graph for Darters.
(a) Does this appear to be a fairly common bird at HBEEC?
(b) Has it appeared to become less common or more common over the years, according to these sightings?
(c) Go to the Bird Descriptions information on the Darters. and suggest some factors that may affect the numbers of this bird in the population, remembering that good food sources and nesting sites are important for population growth.
2. Go to the graph for Herons and Egrets.
(a) Which of the birds in this group has been sighted on most trips over the years?
(b) Has any of this group appeared to have declined in number of sightings?
(c) Birds may (a) live permanently in a given area; (b) be migratory and move to different areas over the year; or (c) nomadic moving wherever it best suits them at the time. According to these sightings, which group (A,B,C) would the following birds appear to belong to?
- Mangrove Heron
- Royal Spoonbill
What other information would you need to be able to support your choice?